Submitting Forecasts
As part of the AI Weather Quest, participating teams are challenged to submit real-time forecasts every week.
New to weather forecasting? No problem! The competition is designed to welcome participants with diverse expertise, including those entirely new to meteorology.
To get started:
- Read the detailed information below to understand the forecast requirements, workflow, and tools you will need to participate.
- Familiarise yourself with the evaluation system to fully understand forecast submission requirements.
- Join the AI Weather Quest forum to stay updated on the competition (including potential updates regarding requirements, tools, resources, evaluation, etc.), ask questions, and connect with fellow participants.
Which forecasts to submit?
Teams are challenged to submit weekly, real-time sub-seasonal forecasts of at least one of the following variables:

Near-surface (2m) temperature (tas)

Mean sea level pressure (mslp)

Precipitation
(pr)

Madden-Julian Oscillation (MJO)

Tropical storms
(TS)
Teams can submit forecasts for any of the following variables. For each variable, the descriptions below summarise what participants are expected to submit and how forecasts are evaluated, with further details available in the Evaluation System webpage:
- Temperature and mean sea level pressure: Forecasts are submitted as weekly averages, which are then evaluated against weekly means calculated using six-hourly data (00, 06, 12 and 18 UTC).
- Precipitation: Forecasts should represent total weekly accumulations, which will be compared against corresponding reanalysis totals.
- Madden-Julian Oscillation: Submitted forecasts are probabilities for each active MJO phase, as well as an inactive state, for every Thursday within the forecasted week. For evaluation, six-hourly wind data (00, 06, 12 and 18 UTC) and daily-accumulated outgoing longwave radiation is used to compute daily-mean atmospheric characteristics.
- Tropical storms: Tercile probabilistic forecasts of tropical storm activity where storm activity is defined by the total number of tropical storms per day, aggregated over the forecasted week. Three-hourly IBTrACS data is used to determine whether a day contains a tropical storm.
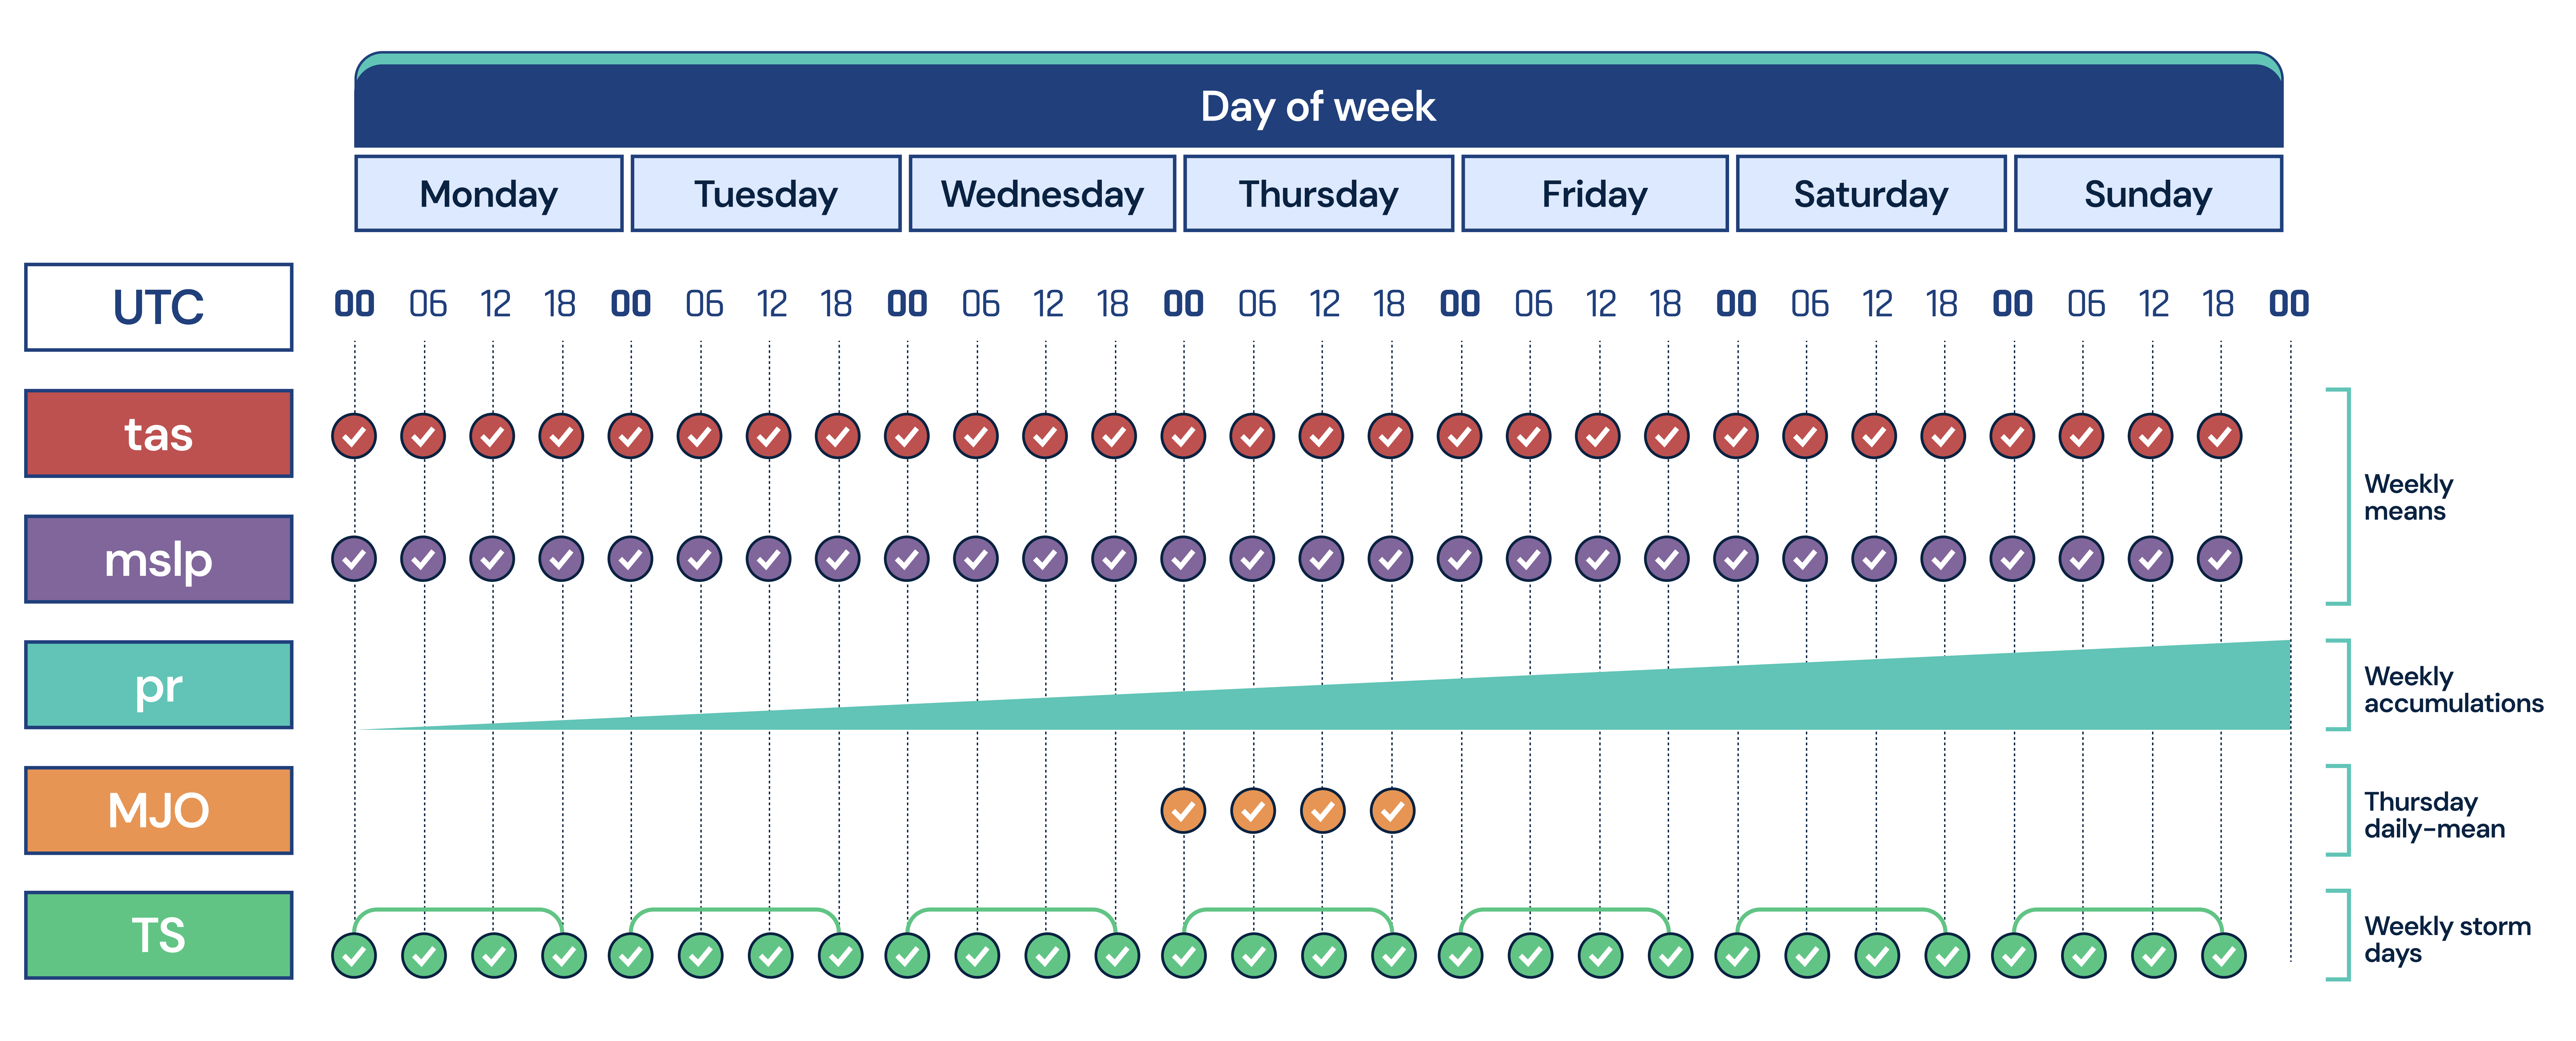
Forecasts of tas, mslp and pr should include global, quintile probabilities at a 1.5-degree latitude/longitude resolution, whilst TS forecasts are basin-based tercile probabilities of TS activity. Forecasts of these variables will be assessed at the following lead times (inclusive):
- Days 19 to 25
- Days 26 to 32
For MJO predictions, participants are required to submit probabilistic forecasts of each MJO phase, as well as an inactive MJO state, at a 22 and 29-day lead time.
To ensure flexibility for AI/ML innovation participants can:
- Submit up to ten forecasted variables per AI model (five variables × two lead times).
- Use up to three different AI/ML models, allowing a maximum of 30 submissions per team each week.
- Develop AI/ML models using any observational or forecast datasets which may include ECMWF-supported datasets.
- Develop AI/ML models using any programming language.
Submissions are welcome from various types of ML/AI models, including (but not limited to):
- Models that post-process numerical weather prediction data.
- Machine-learning based models specifically designed for weather prediction.
- Statistical models that focus primarily on generating quintile probabilities.
- Hybrid models that combine physical simulations with machine-learning techniques.
Innovation is at the heart of this competition. Participants are encouraged to experiment with diverse architectures and methodologies to improve forecast skill and reliability. While competitors should only make minimal model changes during each competitive period, they may refine their models between periods, incorporating lessons learned and keeping pace with rapid advancements in AI and ML.
To promote transparency, forecasts are displayed on an ECMWF-hosted sub-seasonal AI forecasting portal and submitted data is made publicly available upon closing of the submission window.
What are quintile probabilities?
In sub-seasonal forecasting, probabilistic forecasts are computed using model ensembles to account for inherent uncertainties and limited predictability. This provides more actionable information for decision-making.
In the AI Weather Quest, participants are required to compute weekly-mean quintile probabilities, defined by climatological boundaries at 20%, 40%, 60%, and 80%.
Example calculation:
If 15 out of 100 ensemble members predict temperatures exceeding 80% of climatological conditions, and 85 predict conditions between 60% and 80%, the forecasted probabilities would be distributed as follows:
| Climatological range | 0 <= x < 20% | 20 <= x < 40% | 40 <= x < 60% | 60 <= x < 80% | 80 <= x < 100% |
| Number of ensemble members | 0 | 0 | 0 | 85 | 15 |
| Probabilities predicted | 0 | 0 | 0 | 85% | 15% |
| Fraction submitted to AI Weather Quest | 0 | 0 | 0 | 0.85 | 0.15 |
What are tercile-based total storm day forecasts?
Tropical storms are intense low-pressure systems associated with strong winds and organised thunderstorm activity. As they approach or make landfall, they can result in significant societal and economic impacts.
On sub-seasonal timescales, predicting the formation, track and lifetime of tropical storms remains exceptionally challenging. Consequently, many tropical storms forecast products focus on large-scale (up to basin-wide) activity rather than the precise location of individual storms. To encourage broad participation while still providing a meaningful forecast, the AI Weather Quest evaluates tropical storm activity using a simple basin-scale metric termed total storm days.
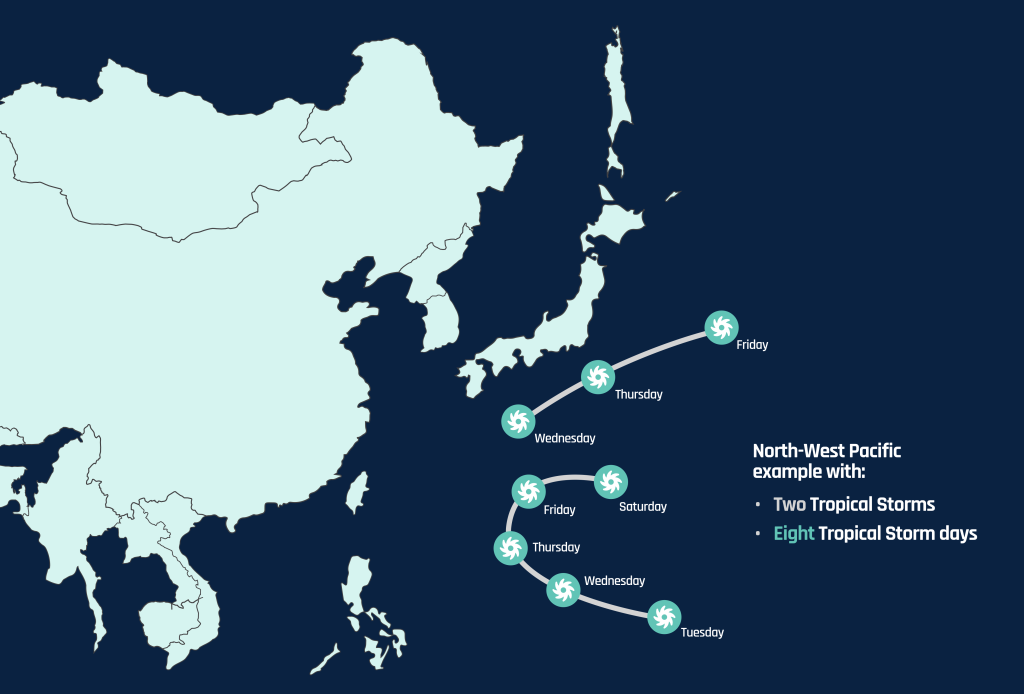
A tropical storm day is defined as a day on which a tropical storm is present within a given ocean basin. A tropical storm is defined when sustained wind speeds are greater than or equal to 17 m s-1, consistent with commonly used tropical storm thresholds. The weekly total storm day count is calculated by summing the number of active storms present on each day of the week. For example, if one storm is active on three days and two storms are active on two further days, the weekly total storm day count would be seven.
Participants are challenged to forecast the probability that the weekly total storm day count will fall within the lower, middle or upper tercile of historical conditions. These terciles represent weeks with relatively low, average and high levels of tropical storm activity, respectively.
The climatological tercile boundaries are derived from the International Best Track Archive for Climate Stewardship (IBTrACS). Similar to the global forecast diagnostics, the boundaries are calculated using 20 years of historical weekly statistics. To improve the robustness of the climatological distributions, the sample size is expanded to 100 historical observations by supplementing data from +/- 4 days around the target date at two-day intervals. As with global variables, forecasts are evaluated probabilistically by comparing the forecast tercile probabilities against the corresponding observed tercile category.
Forecasts are produced independently for four World Meteorological Organisation-defined tropical cyclone basins, with climatological tercile boundaries calculated separately for each basin:
- North Atlantic (ATL): 0° to 40°N, 100° to 20°W
- North-West Pacific (NWP): 0° to 40°N, 100° to 180°E
- South-West Indian Ocean (SWIO): 0° to 40°S, 20° to 90°E
- South-East Indian Ocean (SEIO): 0° to 40°S, 90° to 160°E
Because tropical storm activity exhibits a strong seasonal cycle, forecasts are only evaluated during the climatologically active season of each basin. Consequently, North Atlantic and North-West Pacific forecasts are evaluated during June to November (JJA and SON periods), while South-West and South-East Indian Ocean forecasts are evaluated during December to February (DJF periods). Forecasts issued outside these periods are not included in the competition scoring.
What is the Madden-Julian Oscillation (MJO) and MJO phase probabilities?
The Madden–Julian Oscillation (MJO) is a large-scale mode of sub-seasonal variability characterised by enhanced and suppressed regions of cloudiness, rainfall and atmospheric circulation that propagate eastward around the globe. It is one of the dominant sources of tropical sub-seasonal variability and can influence weather patterns worldwide through atmospheric teleconnections. Consequently, the MJO provides an important source of predictability on sub-seasonal timescales.
The strength and location of the MJO are commonly represented using the Real-time Multivariate MJO (RMM) index developed by Wheeler and Hendon (2004). The RMM index combines information from tropical outgoing longwave radiation and zonal winds at multiple atmospheric levels. After removing seasonal and interannual variability, two principal components are obtained that describe the evolution of the MJO and can be visualised using a Wheeler–Hendon phase-space diagram.
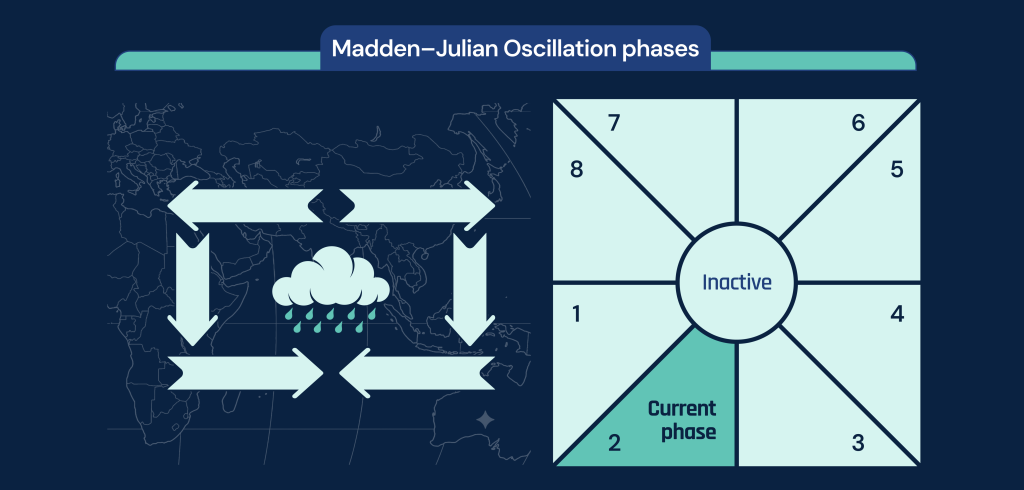
Following Wheeler and Hendon (2004), the MJO state is typically classified into eight phases, each corresponding to the approximate longitudinal location of enhanced tropical convection. In addition to these eight active phases, an inactive state is defined when the amplitude of the MJO is weak and no coherent MJO signal is present.
In the AI Weather Quest, participants are challenged to provide probabilistic forecasts of the MJO phase for each Thursday within the forecast period. Forecasts therefore consist of probabilities assigned to the eight active MJO phases and the inactive state.
For forecast evaluation, seasonally varying climatological phase probabilities are calculated using 20 years of historical MJO observations. As with other forecast variables, the climatological sample is expanded to 100 historical observations by supplementing data from ±4 days around the target date at two-day intervals. These climatological probabilities are used as the reference forecast when calculating forecast skill.
Forecast submission schedule
The AI Weather Quest focuses on sub-seasonal forecasts initialised every Thursday and adheres to a structured submission schedule. This enables direct comparison between sub-seasonal forecasts generated by AI/ML models and those based on traditional dynamical models.
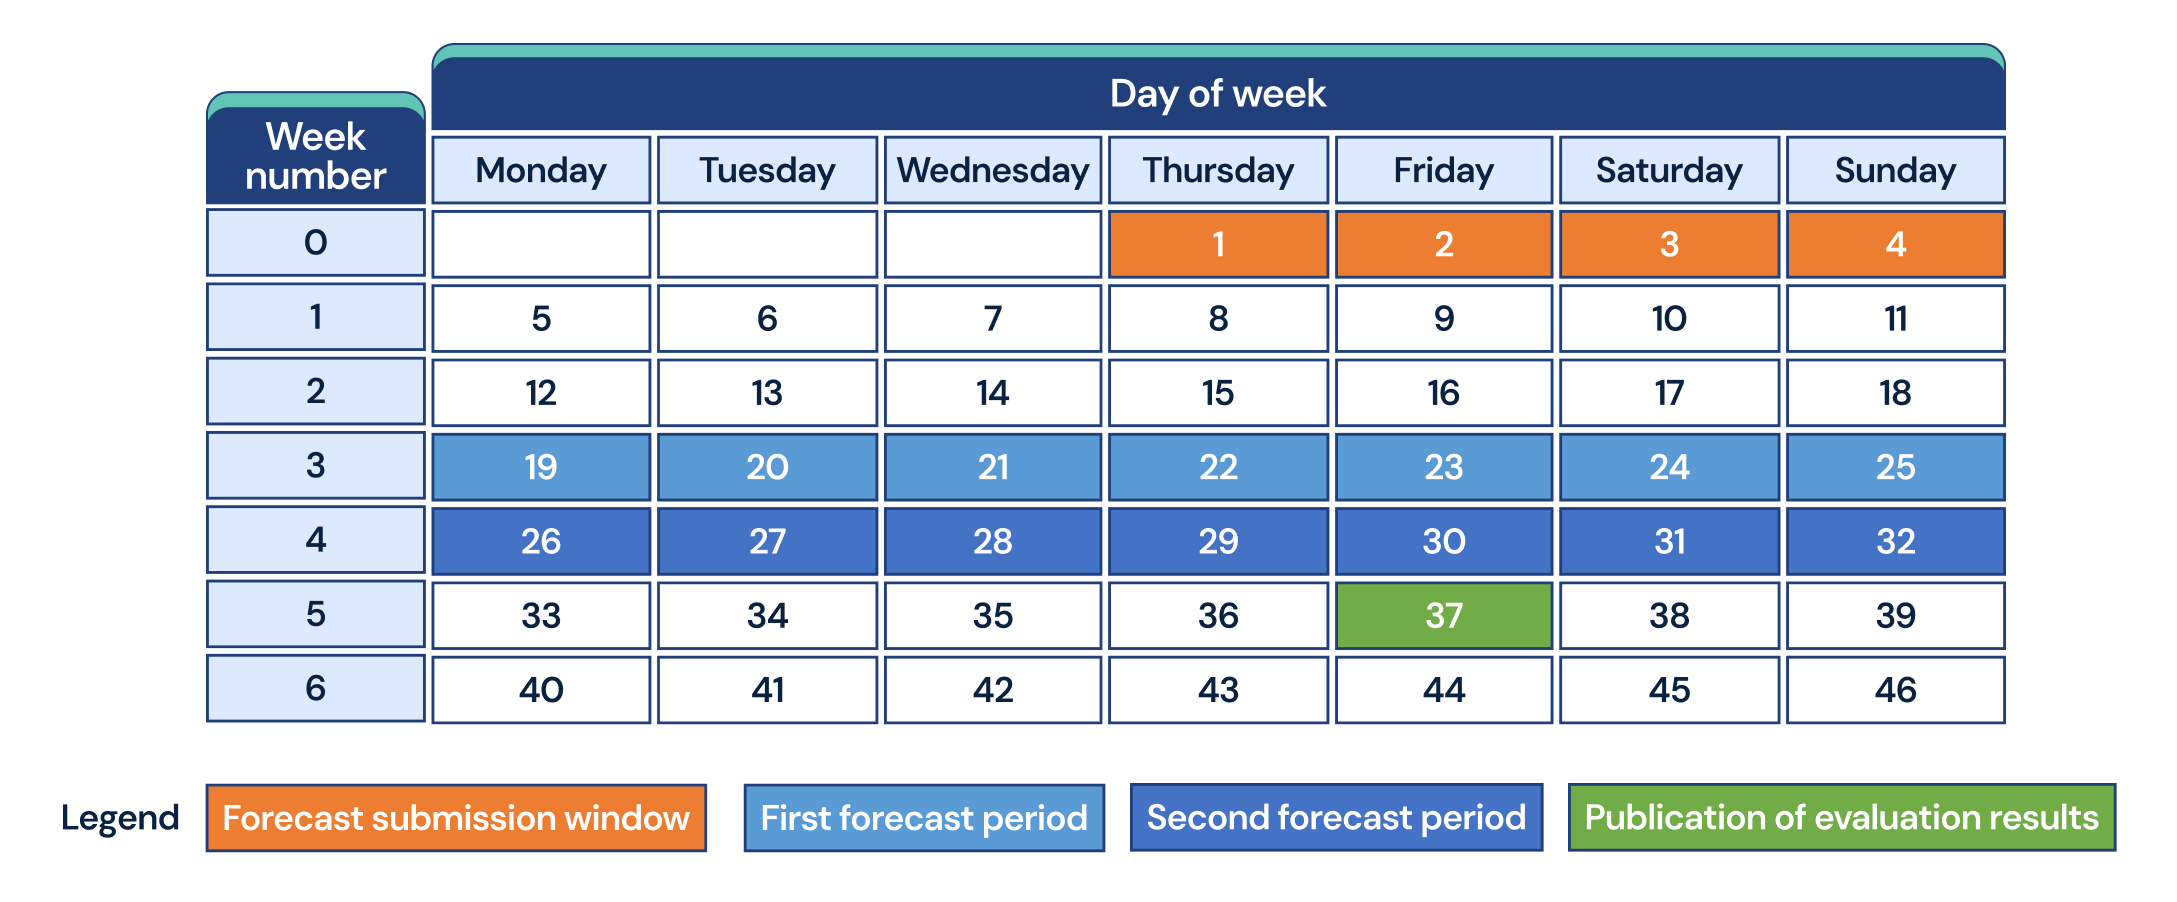
The key dates in the forecast submission schedule are as follows (first DJF 2026 period competition week used as an example):
- Day 1: Forecast initialisation date (Thursday 12th November 2026 00:00 UTC).
Participants may use any data with a timestamp strictly prior or equal to Thursday 00 UTC to initialise their models, regardless of when the data becomes available. The four-day submission window allows participants to process initial data with relatively long latency (e.g. dynamical sub-seasonal forecast data which has a two-day delay) and provides additional time for those with limited computational resource to submit their forecasts.
- End of day 4: Forecast submission closes (Sunday 15th November 2026 23:59 UTC).
A four-day submission window accommodates for varying resource capabilities. - Days 19 to 25: First forecast window (Monday 30th November 2026 to Sunday 6th December)
- Days 26 to 32: Second forecast window (Monday 7th December 2026 to Sunday 13th December)
- Day 37: Forecast evaluation publication (Friday 18th December 2026 00:00 UTC)
Access the full detailed schedule
How to submit your forecasts
Forecasts must be submitted using the AI-WQ-package, a Python package designed to ensure compatibility with the evaluation system and visualisation portal. Detailed installation instructions and user guidance for all modules can be found in the official package documentation.
The following steps provide a summary of the submission process using the forecast_submission.py module included in the package:
- Use the AI_WQ_create_empty_dataarray function to generate an empty xarray.DataArray.
- Populate the array with forecast probabilities.
- Submit using the AI_WQ_forecast_submission function.
Please note, several checks on filename and data characteristics are taken before accepting submissions. A full list of these checks is available in the official package documentation.
Participants can use the plotting_forecast.py module to generate global visualisations of forecast probabilities, helping them perform personal quality control.
You will need your forecast-submission password to submit forecasts. This password is provided upon registration.
Join the QuestIssues or questions?
We encourage participants to promptly report any technical concerns or issues. Please reach out to the competition organisers through the following channels:
AI Weather Quest forum
For general inquiries and discussions. Updates or clarifications that benefit multiple teams will be shared publicly on the AI Weather Quest forum.
Contact Us form
For individual or private matters requiring direct assistance.